


The Hidden
Cost of Too Many Dashboards: Why Infrastructure Visibility Gets Harder as Systems Grow
The Hidden Cost of Too Many Dashboards: Why Infrastructure
Visibility Gets Harder as Systems Grow A few
The Hidden Cost of Too Many Dashboards: Why Infrastructure Visibility Gets Harder as Systems Grow
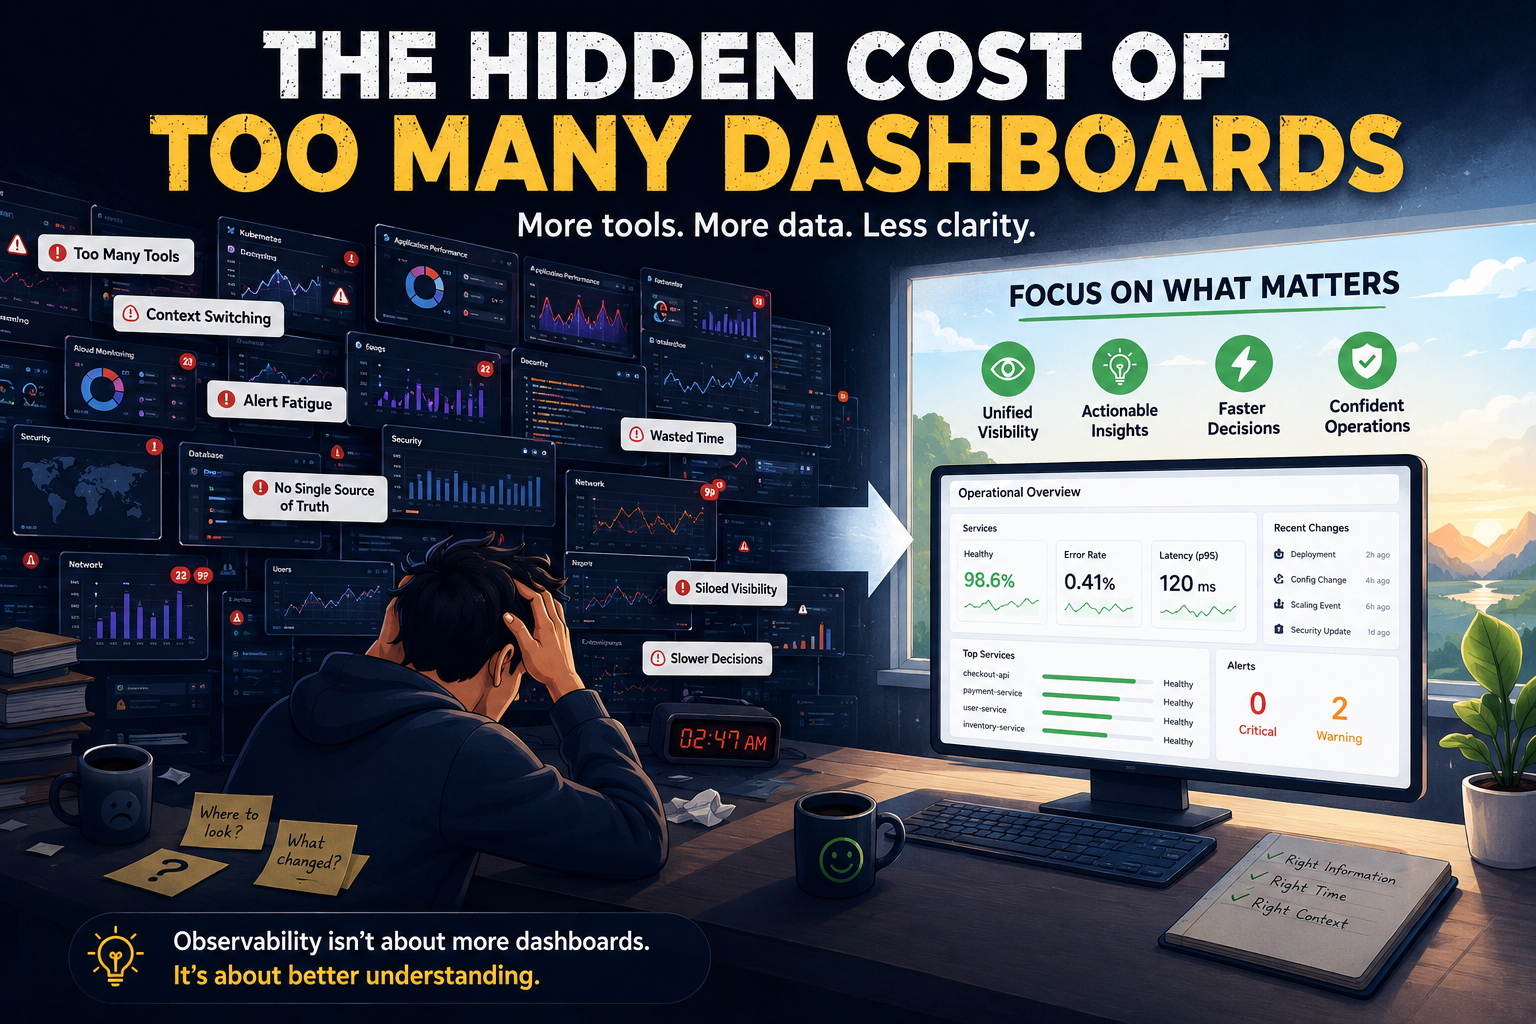
A few years ago, most infrastructure teams had a visibility problem.
When production issues happened, engineers struggled because they simply didn’t have enough information. Metrics were incomplete, logs were scattered across systems, and troubleshooting often relied on SSH sessions, manual checks, and educated guesses. If an application started behaving unexpectedly, the first challenge was gathering enough data to understand what was happening.
Today, many organizations face the exact opposite problem.
Modern infrastructure environments generate an enormous amount of operational data. Kubernetes exposes cluster metrics. Cloud platforms provide monitoring services. Applications generate traces and logs. CI/CD systems produce deployment events. Security tools create alerts. Databases expose performance metrics. Every layer of the stack contributes its own view of reality.
On paper, this should make operations easier.
In practice, many engineering teams are discovering something unexpected: despite having more visibility than ever before, production incidents are not necessarily becoming easier to understand.
In many cases, they’re becoming harder.
The problem isn’t a lack of observability.
The problem is that observability has become fragmented.
When Every Team Has a Dashboard, Nobody Has the Full Picture
As infrastructure grows, dashboards tend to multiply naturally.
Platform teams build Kubernetes dashboards to track cluster health. Application teams create service-level monitoring views. Security teams maintain separate dashboards for authentication, compliance, and threat detection. Cloud teams monitor infrastructure costs, resource consumption, and platform services. Database administrators maintain performance dashboards focused on storage, queries, and replication.
Every dashboard serves a purpose.
Every dashboard solves a specific problem.
The issue appears when something breaks.
Production incidents rarely stay within the boundaries of a single tool or team. A performance issue that initially looks like an application problem may actually be caused by a database bottleneck. A networking issue may surface as increased API latency. A deployment that completed successfully may introduce runtime behavior that only appears under production traffic.
When incidents cross operational boundaries, engineers suddenly find themselves moving between multiple monitoring systems trying to understand what is actually happening.
And that’s where dashboard sprawl begins to create real operational costs.
The Incident Isn’t Hard. Finding the Starting Point Is.
One of the most frustrating aspects of modern troubleshooting is that many incidents are not difficult to solve once the root cause is known.
The difficult part is figuring out where to begin.
Consider a fairly common scenario.
A deployment completes successfully. Health checks pass. Infrastructure metrics look healthy. CPU and memory utilization remain within expected ranges.
Then users begin reporting slow response times.
Nothing appears obviously broken.
One engineer checks Kubernetes metrics. Another reviews application performance dashboards. Someone else investigates database latency. The platform team starts looking at networking metrics. Deployment history is reviewed to determine whether a recent release introduced the behavior.
Thirty minutes later, everyone has information.
Nobody has understanding.
This is a surprisingly common pattern in modern infrastructure environments.
The challenge is not collecting data. The challenge is assembling a coherent operational story from dozens of disconnected sources.
More Visibility Doesn’t Automatically Create More Understanding
There is a common assumption in infrastructure operations that adding another dashboard improves observability.
For a while, it does.
A new dashboard provides better visibility into a service. Another helps monitor Kubernetes workloads. A third improves deployment tracking. A fourth helps identify infrastructure bottlenecks.
Individually, each dashboard delivers value.
Collectively, they can create an entirely different problem.
Engineers eventually reach a point where every system knows something, but no system knows enough.
Important operational context becomes scattered across dashboards, logs, alerts, traces, deployment histories, ticketing systems, and chat channels. During an incident, engineers become responsible for connecting those pieces manually.
The observability platform may contain the answer.
The challenge is knowing where to look first.
As environments grow larger, that challenge becomes increasingly expensive.
Dashboard Sprawl Creates a Different Kind of Blind Spot
Most teams associate operational blind spots with missing data.
In reality, excessive fragmentation can create the same outcome.
When engineers are overwhelmed by monitoring systems, they naturally begin prioritizing familiar sources of information. Certain dashboards become trusted. Others are opened only when absolutely necessary. Some monitoring views contain valuable operational signals but are rarely checked because they require additional effort during already stressful situations.
Over time, organizations develop a strange form of observability blindness.
Critical information exists.
The data is being collected.
The monitoring systems are functioning correctly.
But important signals remain hidden because nobody can realistically process everything during a production incident.
This isn’t a tooling problem.
It’s a human problem.
And it becomes more significant as infrastructure complexity grows.
The Real Cost Is Cognitive Load
One of the most overlooked challenges in infrastructure operations is cognitive load.
Every dashboard introduces another way of thinking about a system.
Different terminology. Different visualizations. Different alert structures. Different assumptions. Different navigation patterns.
During troubleshooting, engineers constantly switch contexts.
One screen shows Kubernetes workloads. Another displays application metrics. A third focuses on database performance. A fourth tracks deployment history. A fifth contains security events.
None of these perspectives are wrong.
The problem is that engineers must mentally combine them while simultaneously responding to a live incident.
Under pressure, that process becomes exhausting.
The result is slower investigations, longer incident resolution times, and increased operational fatigue.
Most organizations measure infrastructure performance carefully.
Far fewer measure the cognitive burden placed on the engineers responsible for operating it.
Why Mature Engineering Teams Focus on Context, Not Dashboards
Experienced platform teams eventually realize that operational visibility is not really about charts, graphs, or dashboards.
It’s about context.
The goal of observability isn’t to show more information.
The goal is to help engineers answer operational questions quickly.
Questions like:
- What changed recently?
- Is this related to a deployment?
- Which services are affected?
- Is the issue isolated or widespread?
- Which dependency is contributing to the problem?
- Has this happened before?
These questions drive incident response.
The faster teams can answer them, the faster they can restore service and reduce business impact.
That’s why mature observability strategies focus less on creating new dashboards and more on connecting operational context across systems.
Because understanding relationships is usually more valuable than collecting additional metrics.
The Best Dashboards Are the Ones Engineers Rarely Need to Think About
The most effective infrastructure environments are not necessarily the ones with the most monitoring tools.
They’re the ones where engineers can move from detection to understanding with minimal effort.
When an alert fires, teams should not spend twenty minutes determining where to investigate.
The path should be obvious.
Engineers should be able to quickly understand:
- what changed,
- which systems are affected,
- where the failure originated,
- and what actions need to happen next.
That level of clarity doesn’t come from adding more dashboards.
It comes from reducing operational complexity.
The best observability experiences feel almost invisible because they eliminate unnecessary decision-making during critical moments.
Infrastructure Visibility Is Becoming an Engineering Problem
As organizations continue adopting Kubernetes, cloud-native architectures, microservices, automation platforms, and distributed systems, infrastructure visibility will only become more challenging.
The answer is not building another dashboard for every new component.
Eventually, teams must shift their focus from collecting more telemetry to improving how telemetry is connected and understood.
Because the biggest challenge facing many infrastructure teams today isn’t missing visibility.
It’s transforming visibility into understanding.
And that’s a much harder problem to solve.
Final Thoughts
The hidden cost of too many dashboards isn’t software licensing, infrastructure overhead, or monitoring expenses.
It’s the operational complexity they introduce when every system tells only part of the story.
Most modern engineering teams are not suffering from a lack of data.
They are struggling with a fragmented context.
As infrastructure grows, observability becomes less about collecting information and more about helping engineers make sense of it quickly during the moments that matter most.
The organizations that solve this problem successfully won’t be the ones with the most dashboards.
They’ll be the ones that help engineers understand their systems with the least amount of effort.
Recent Posts
- The Hidden Cost of Too Many Dashboards: Why Infrastructure Visibility Gets Harder as Systems Grow
- Why Kubernetes Starts Feeling Unpredictable After a Certain Scale
- Server Deployment Automation: Why Reliable Deployments Become Difficult at Scale
- Modernizing Server Build Workflows for Scalable DevOps Operations
- CI/CD Pipeline Chaos: Why Modern DevOps Teams Need Better Workflow Automation